GHOSTVPS / Automation
Monitor a Linux VPS with Prometheus and Grafana, then test an alert
Collect real CPU, memory and disk metrics, build a dashboard and prove a target-down alert actually fires.
Updated · GhostVPS
Before you start
A Linux VPS you administer, a separate monitoring location or isolated test environment, enough storage for metrics, and access to Prometheus, Node Exporter and Grafana from their official release sources. The screenshots are from an isolated lab on loopback-only ports 19090, 19100 and 13000; normal installations often use 9090, 9100 and 3000. Do not expose these interfaces publicly without authentication and network controls.
Decide what to observe and protect access
Choose a host where you can run Node Exporter and a monitoring instance that can reach it. Keep the metrics endpoint and dashboards private; a loopback-only lab is sufficient for practice. Download supported releases from the official sources, verify their published checksums, run services as non-root users and plan storage retention before collecting data. This example monitors one Linux VPS; it does not claim to monitor GhostVPS customer infrastructure.
Start Node Exporter and verify its metrics
Node Exporter publishes host metrics over HTTP. In a normal single-host installation the default endpoint is localhost:9100; our isolated capture used localhost:19100 to avoid port conflicts. Confirm the endpoint returns metrics before configuring Prometheus. If it fails, inspect process status and local firewall rules. Never copy the lab port into production without checking your actual setup.
Your VPS · Linux terminal
curl -fsS http://127.0.0.1:9100/metrics | headAdd the scrape target and check health
Configure Prometheus to scrape the exact Node Exporter endpoint. Validate the YAML with promtool, restart or reload Prometheus and inspect Status → Target health. The target should show UP and a recent scrape. The screenshot records the lab with both Prometheus and Node Exporter UP. For a remote VPS use its private address or an authenticated tunnel rather than opening the exporter to the Internet.
File contents
global:
  scrape_interval: 15s
rule_files:
  - alerts.yml
scrape_configs:
  - job_name: node
    static_configs:
      - targets: ['127.0.0.1:9100']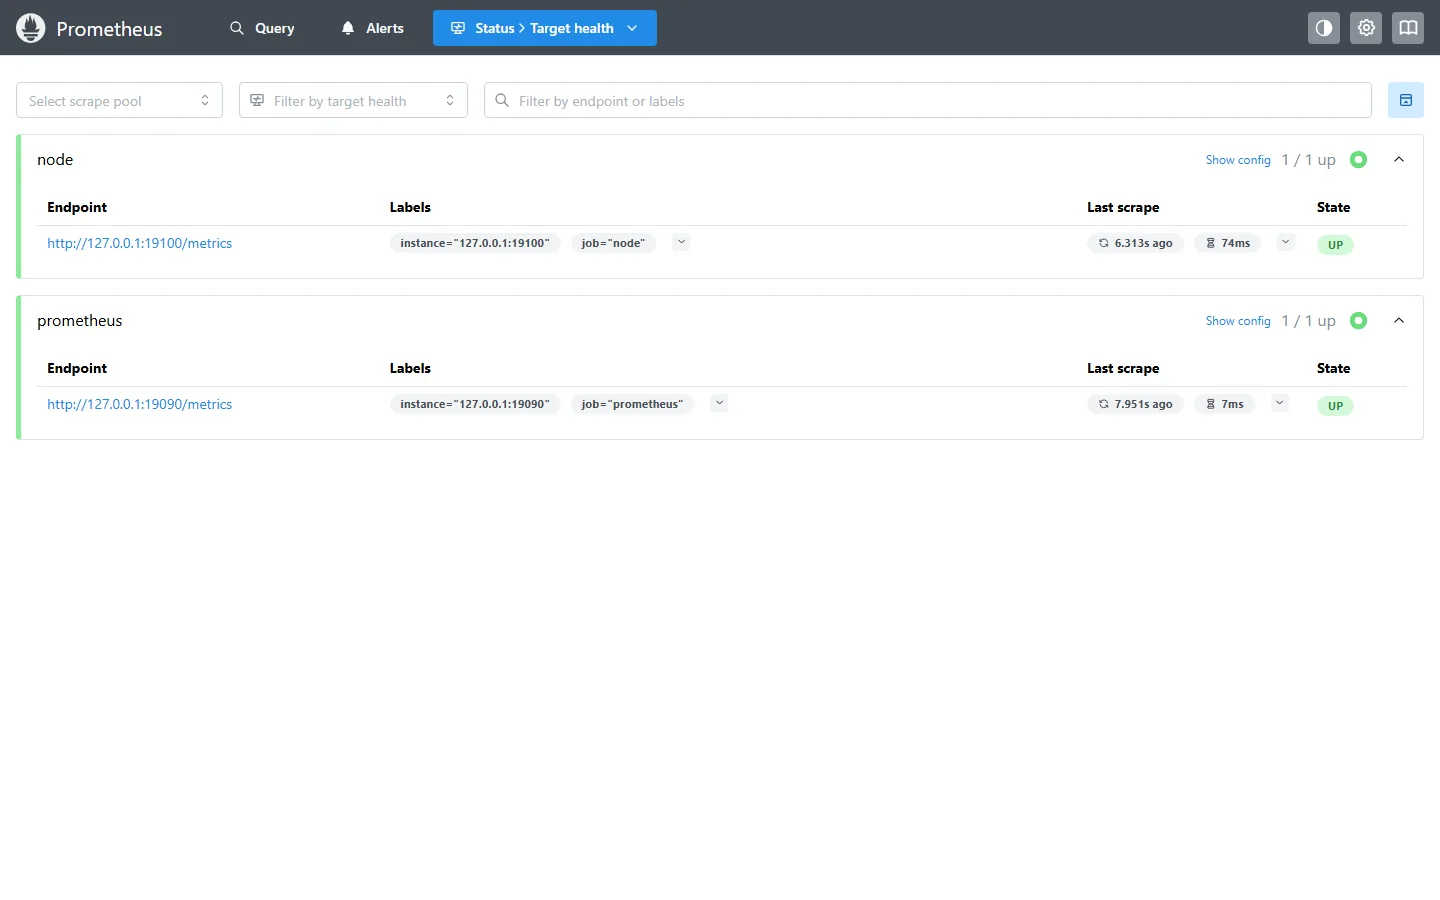
Connect Grafana and build a useful dashboard
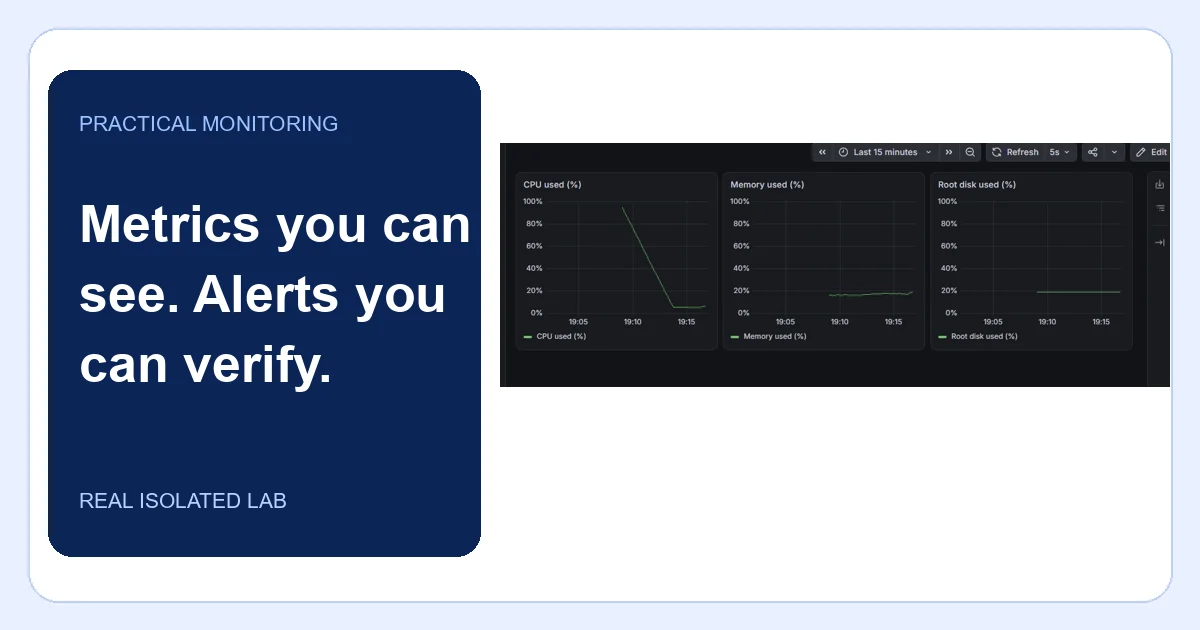
Add Prometheus as a Grafana data source using the URL reachable from the Grafana server, then test the connection. Create panels for CPU used, memory used and root disk used. The sample PromQL expressions are starting points; confirm metric names and filesystem labels in your own target, and exclude virtual filesystems where appropriate. In our lab all three panels showed live data. Set refresh and retention to match your monitoring budget.
File contents
100 * (1 - node_memory_MemAvailable_bytes / node_memory_MemTotal_bytes)
100 * (1 - node_filesystem_avail_bytes{mountpoint="/"} / node_filesystem_size_bytes{mountpoint="/"})
100 * (1 - avg(rate(node_cpu_seconds_total{mode="idle"}[5m])))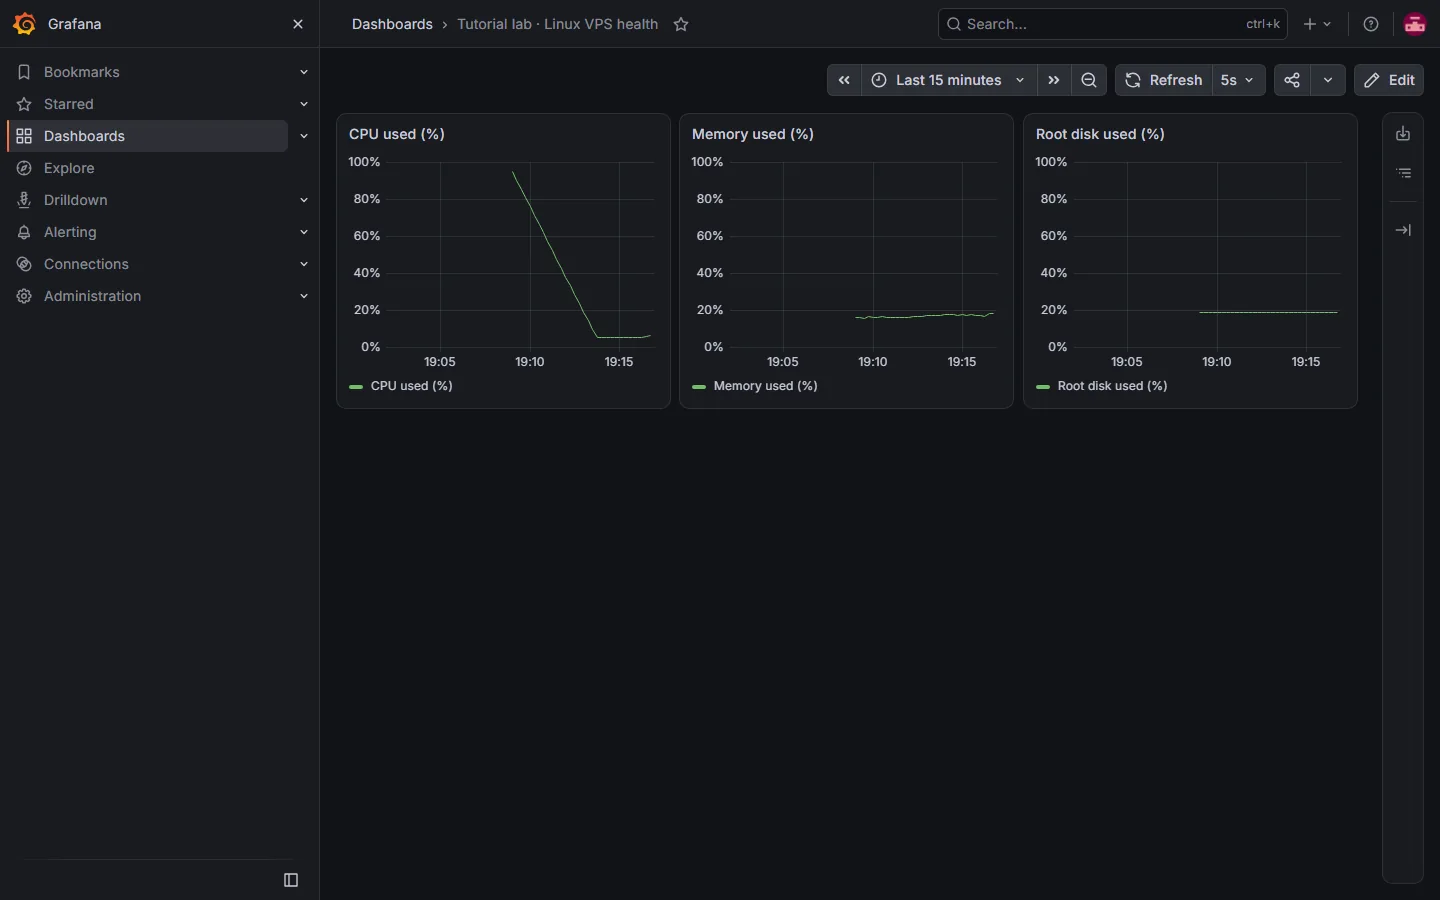
Create and deliberately test an alert
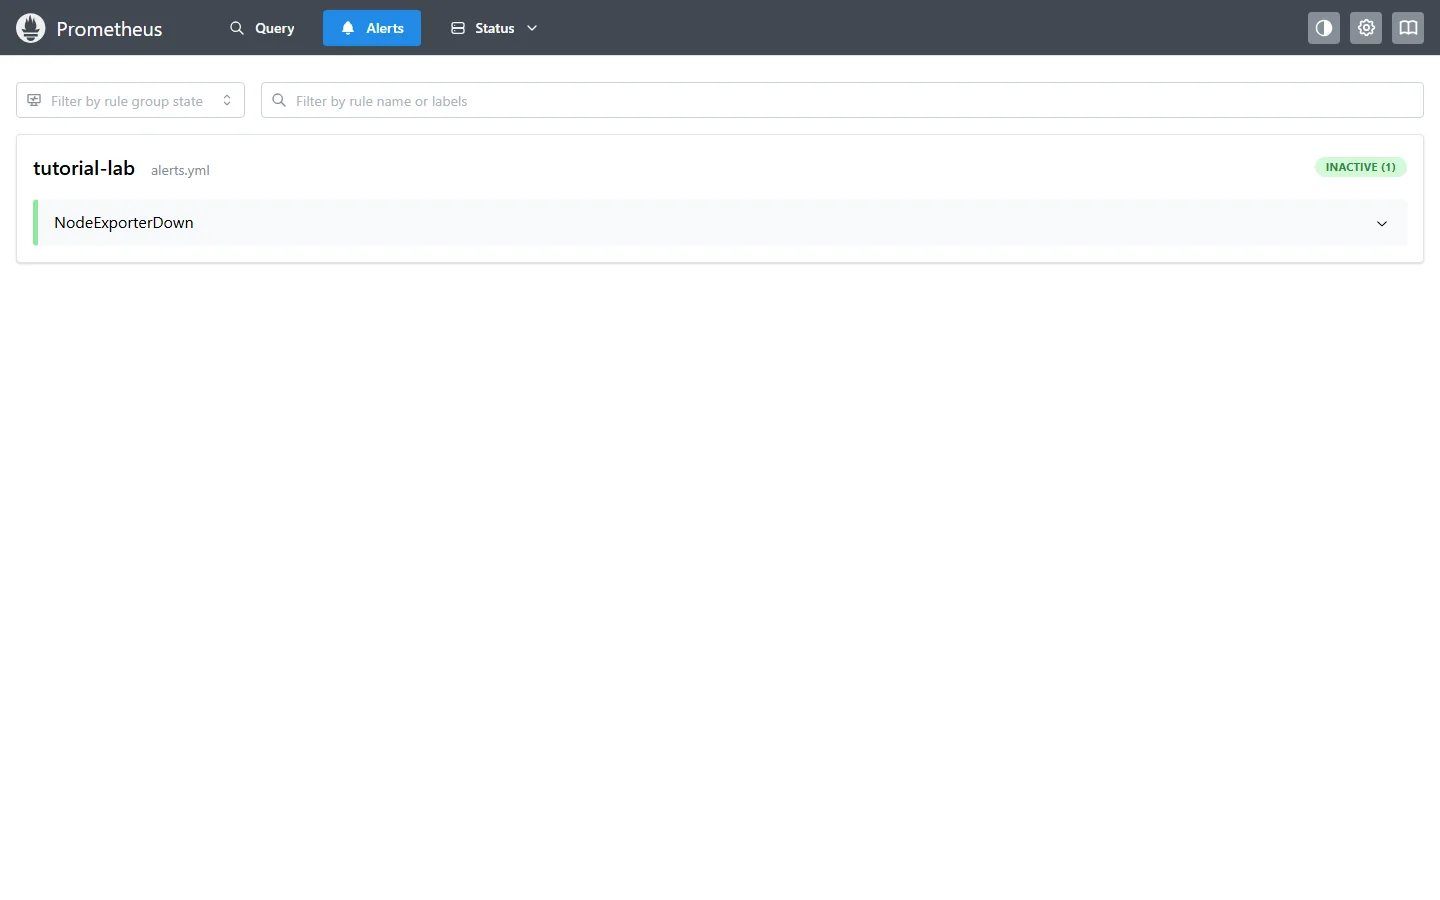
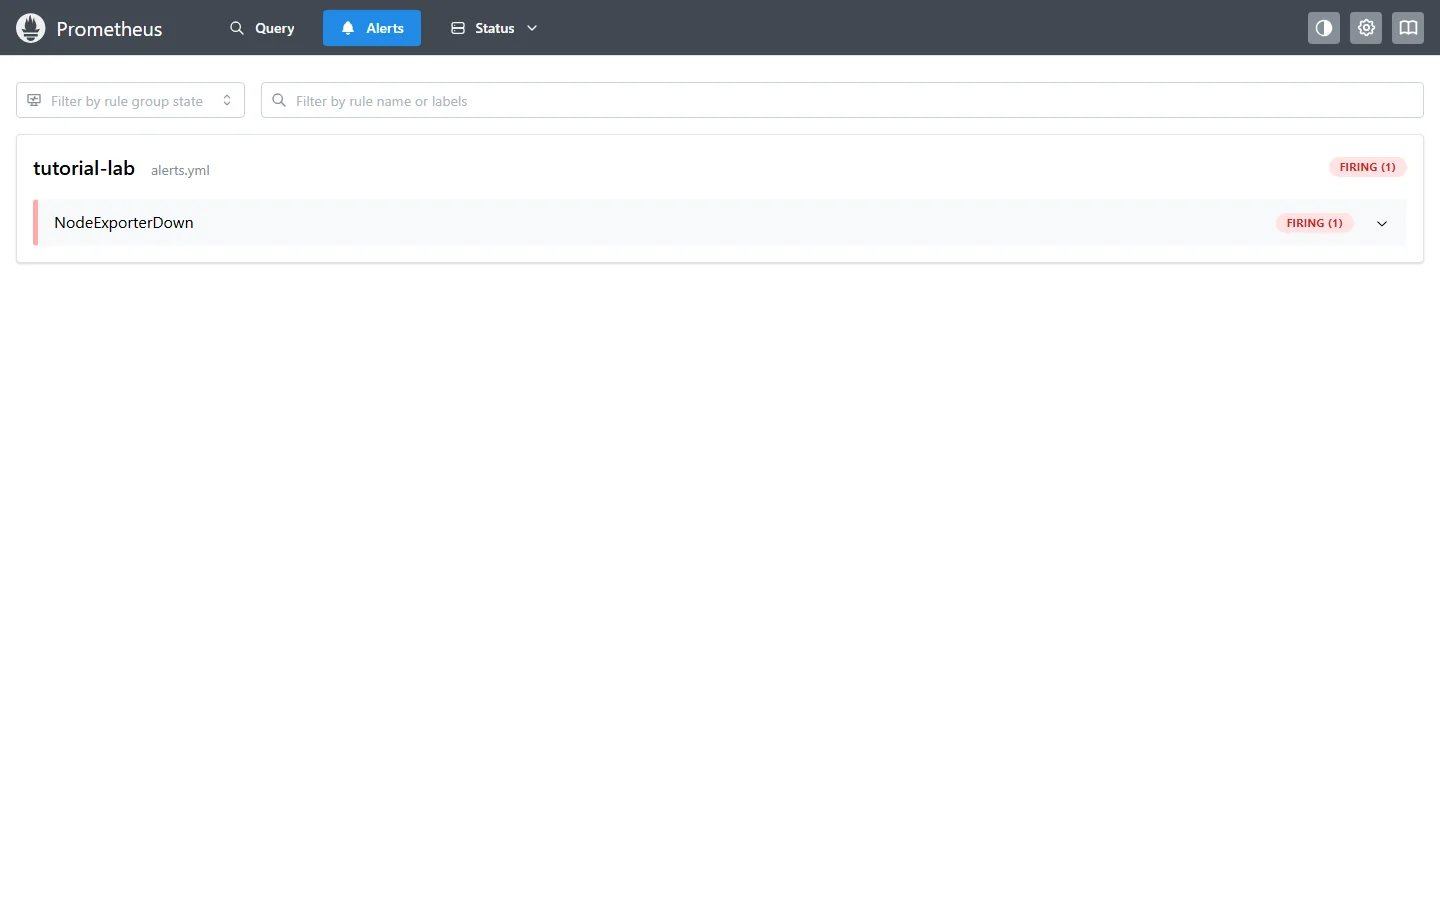
The rule below detects a configured Node Exporter target that is being scraped but is unreachable. The two-minute hold period is a production-oriented starting point; our isolated demonstration shortened it to ten seconds to verify the flow. Stop only the exporter in a disposable lab, watch the target become DOWN and the alert become FIRING, then restart it. This test proves rule evaluation, not message delivery. To receive notifications, configure and test a Grafana or Alertmanager contact point separately.
File contents
groups:
  - name: vps-health
    rules:
      - alert: NodeExporterDown
        expr: up{job="node"} == 0
        for: 2m
        labels:
          severity: warning
        annotations:
          summary: Node exporter is unreachable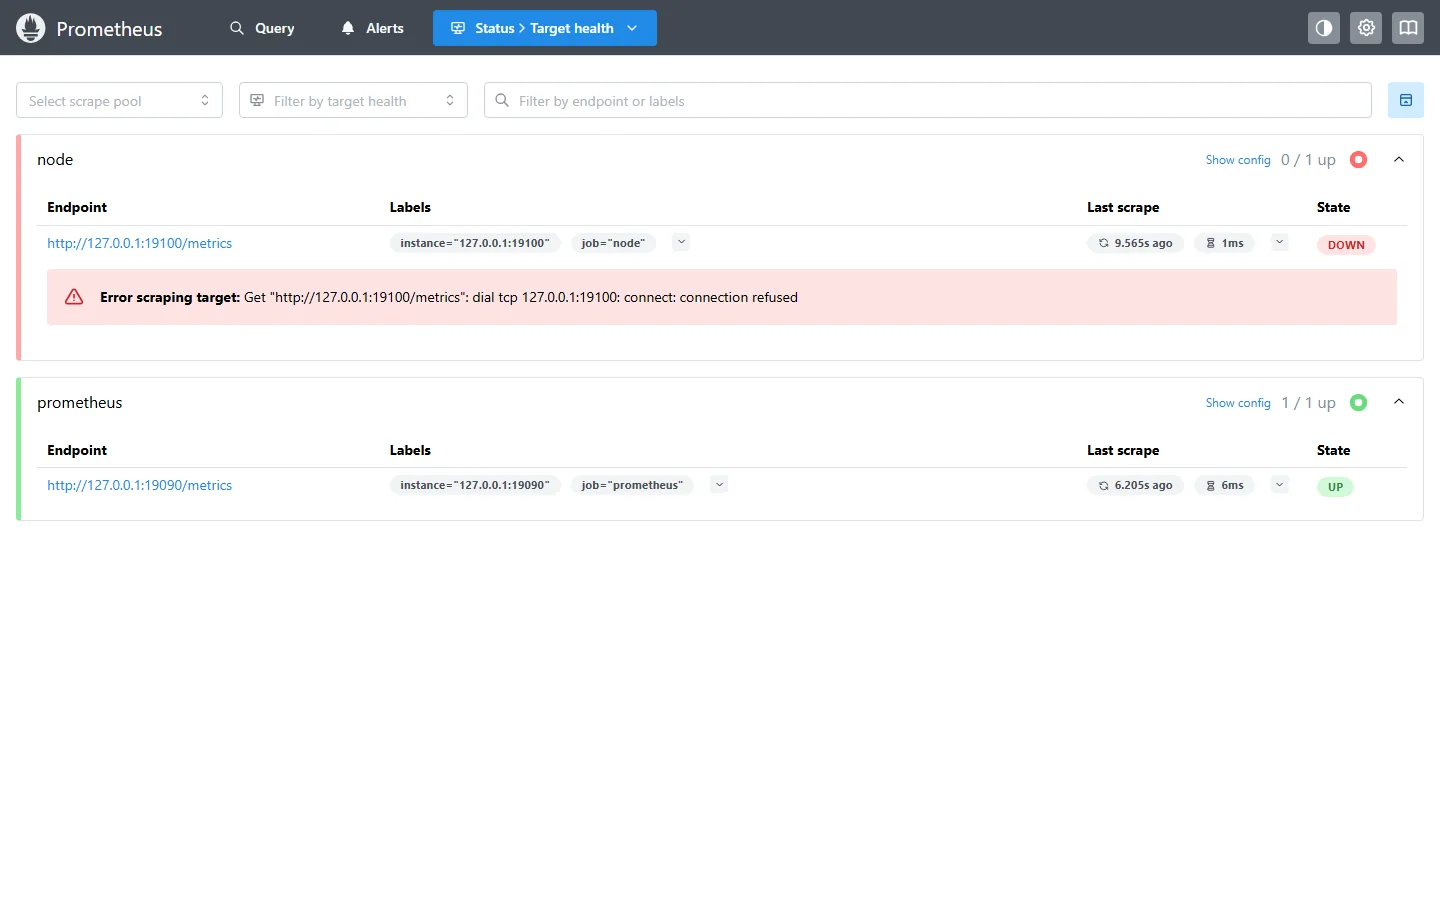
Recover, verify and keep the setup maintainable
After restarting the lab exporter, both targets returned to UP and the alert became INACTIVE. In your own environment also test a disk threshold against a safe test metric and verify the notification reaches the intended recipient. Document who responds, keep dashboards and rules in version control, and review them after service or instance changes. Do not simulate a full disk or shut down a production exporter merely to test a rule.