GHOSTVPS / Operations
Diagnose a slow Linux VPS before changing its plan
A repeatable check for CPU pressure, memory, disk capacity, I/O and application errors using real command output.
Updated · GhostVPS
Before you start
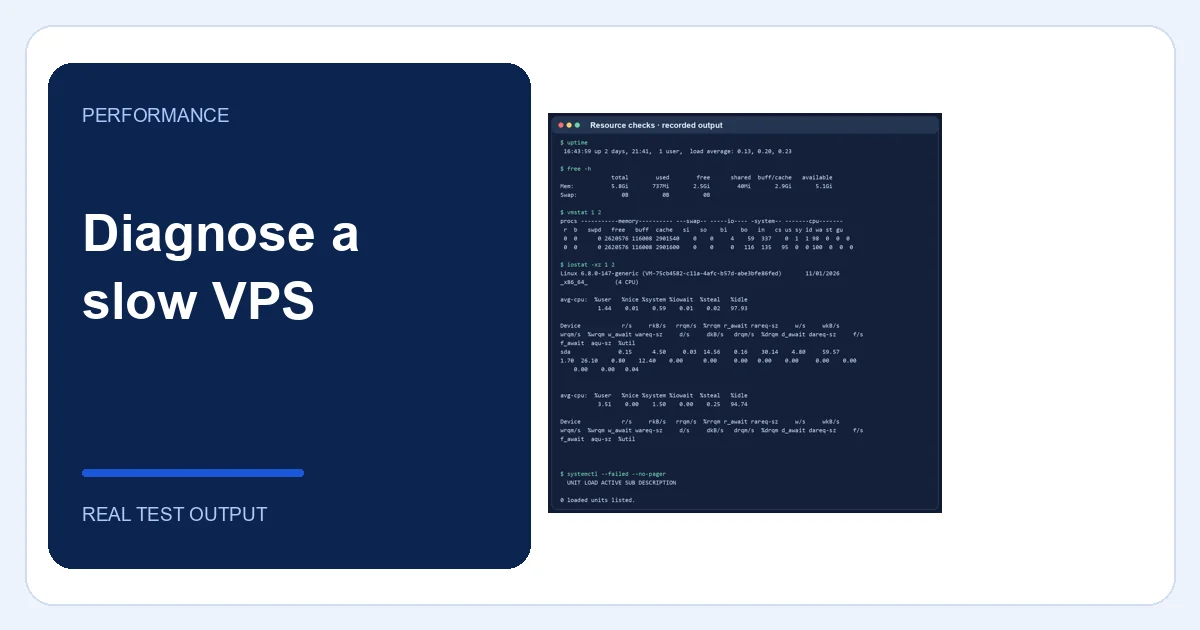
SSH access to a Linux VPS you administer and permission to read its metrics and logs. The images record a short, read-only observation of a GhostVPS lab host; they do not depict a slow customer server. Replace YOUR_SERVICE with the actual unit name.
Capture the time and the symptom
Write down when the slowdown happens, which URL or task is affected, and whether all users see it. Check uptime and load alongside available memory. A high load number alone is not proof of CPU saturation: waiting processes and disk I/O can also raise it. Compare with a normal period before changing resources.
Your VPS · Linux terminal
date -Is
uptime
free -hCheck CPU and runnable pressure
Sample vmstat for several seconds rather than relying on a single snapshot. Look at runnable processes, user/system CPU and idle time; then identify the process responsible. In the captured lab, CPU was mostly idle, so increasing CPU would not have been a justified diagnosis. Avoid killing a process until you know its role and impact.
Your VPS · Linux terminal
vmstat 1 5
ps -eo pid,comm,%cpu,%mem --sort=-%cpu | head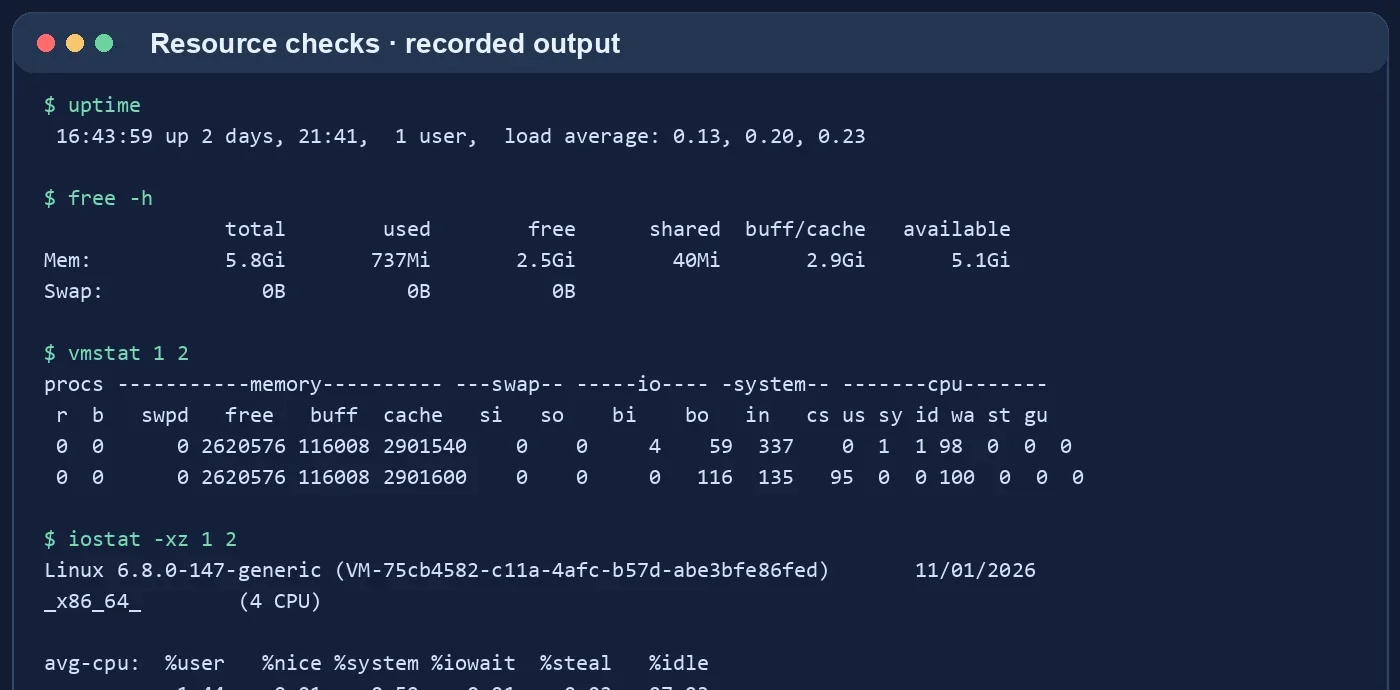
Check available memory and OOM events
Read the available column in free, not only the free column, because Linux can reclaim cache. Look for recent out-of-memory messages in the kernel journal. If memory is genuinely exhausted, identify the consuming process and its configuration before scaling the VPS. A missing OOM message does not rule out every memory bottleneck.
Your VPS · Linux terminal
free -h
journalctl -k --since "1 hour ago" --no-pager | grep -i -E "out of memory|oom"Separate disk capacity from disk I/O
Use df -h for free bytes and df -i for inode exhaustion, then sample iostat for latency and device busy time. Disk at 95% capacity is a different problem from a slow disk with space remaining. The first iostat report may summarize time since boot; focus on subsequent interval samples. Do not infer a hardware fault from a single utilization number.
Your VPS · Linux terminal
df -h
df -i
iostat -xz 1 5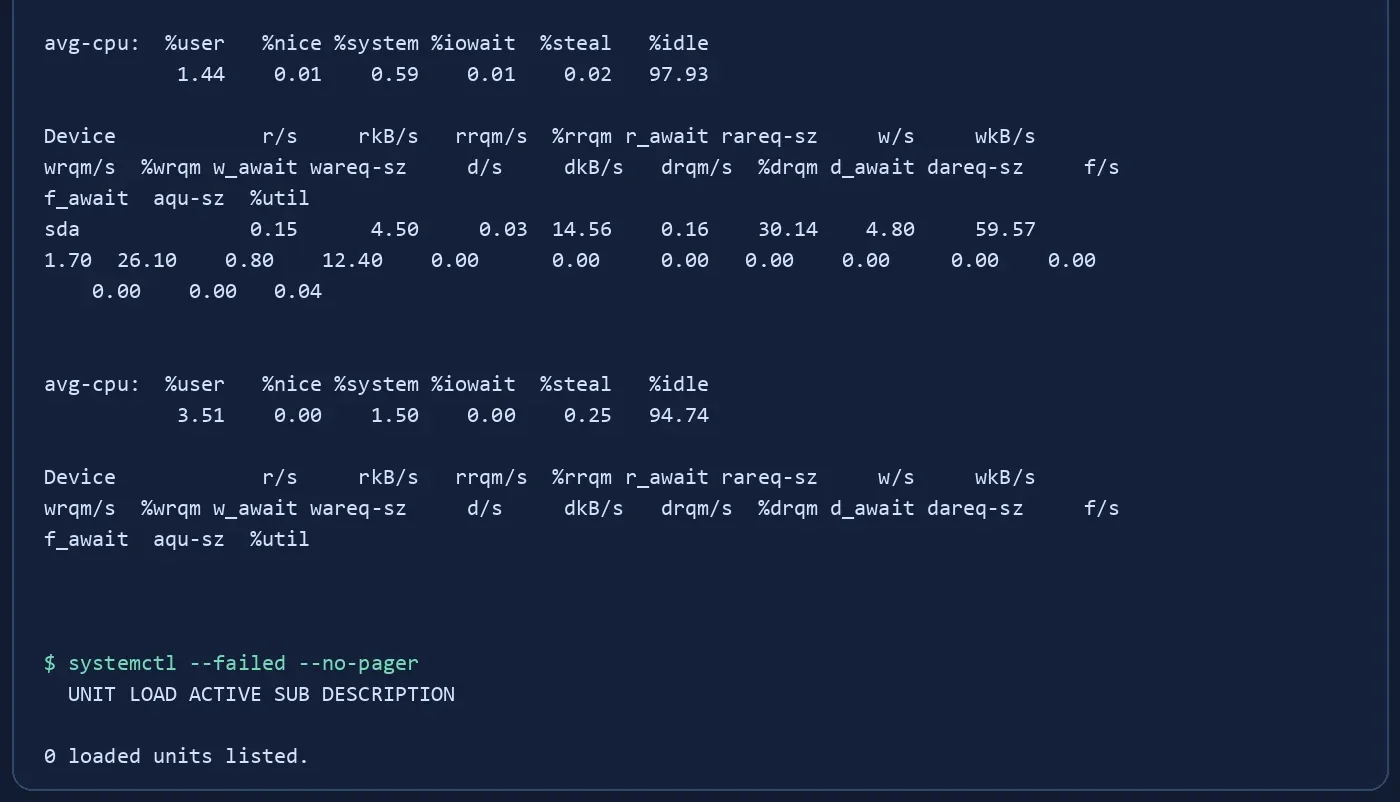
Inspect the failing application and its logs
Check failed services and the relevant unit journal only after identifying the actual service name. Test the application locally and from outside, if possible, to distinguish application errors from network or DNS problems. Record the error and timestamp before restarting anything; repeated restarts can hide the evidence.
Your VPS · Linux terminal
systemctl --failed --no-pager
systemctl status YOUR_SERVICE --no-pager
journalctl -u YOUR_SERVICE --since "30 minutes ago" --no-pagerAct on the measured cause and verify
If CPU is consistently saturated by a legitimate workload, optimize or scale. If memory is exhausted, tune the process or increase RAM. If disk space is low, follow the separate disk cleanup guide; if only one service fails, fix that service. Repeat the same measurements after the change and compare with the original symptom.