Prometheus and Grafana on a VPS: what should you monitor first?
Choose useful host and application signals, keep the monitoring system reachable and test alerts before relying on a dashboard.
Updated

A monitoring dashboard is useful only when it helps you detect a real problem and decide who acts. Prometheus can collect metrics and Grafana can display and alert on them, but neither replaces backups or an external availability check. Start with the questions you need answered, then choose the deployment.
Choose the signals before choosing the server
For one VPS, begin with CPU saturation, available memory, filesystem free space, disk activity, network errors and whether the application actually answers a request. Add a database or queue metric only if you run that service. A public website also needs a check from outside the VPS: an exporter on the same failing machine cannot prove that customers can reach it. Write down what “healthy” means for your workload before setting alert thresholds.
Decide where metrics will live
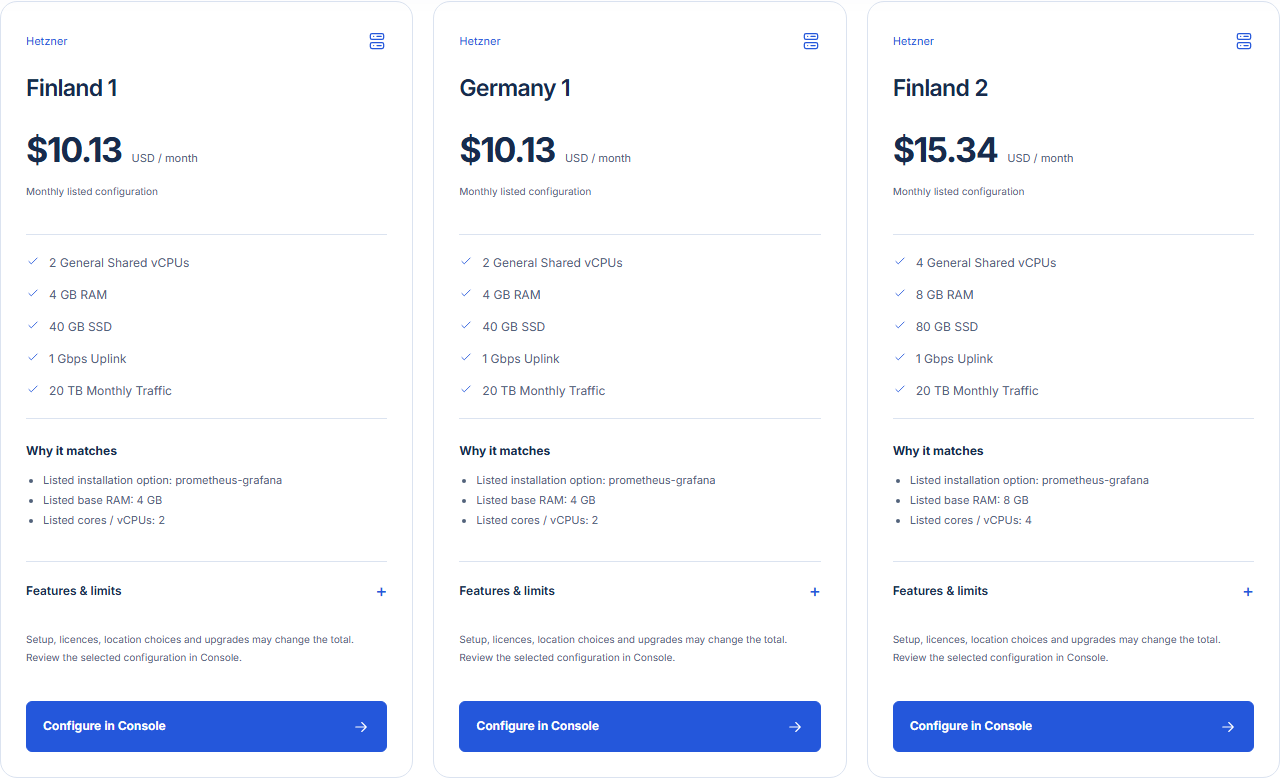
The Prometheus + Grafana application offers a starting point on a supported VPS. For a small environment, one instance may be enough to learn and monitor several targets. For critical production services, consider separating monitoring from the application it watches: a failure of the application host should not erase all visibility. Estimate retention, disk growth and backup needs from the number of targets and the actual scrape interval; no universal VPS size fits every installation.
Prometheus’s Node Exporter guide explains host metrics and notes that Windows needs a corresponding exporter. Keep scrape endpoints private or authenticated as appropriate, and do not publish Grafana or Prometheus admin interfaces to everyone. Record who owns upgrades, dashboard access and data retention.
Build alerts that lead to an action
Start with a few conditions: a service is unreachable, disk space trends toward exhaustion, an exporter stops reporting, or memory pressure persists. Use a duration and notification route that fit the service; a brief spike should not wake someone unless it affects users. Grafana’s alert rule documentation describes evaluation and notification behavior. Send a test alert and confirm the right person receives it.
| Signal | Question it answers | First response |
|---|---|---|
| External reachability | Can users get a response? | Check DNS, network and application logs |
| Free disk | Will writes or backups soon fail? | Inspect growth and retention before deleting data |
| Exporter health | Is monitoring data still arriving? | Check exporter service and scrape access |
| Backup age | Is a recent recovery point available? | Run the backup and an isolated restore test |
Run a short monitoring exercise
Make a dashboard with one application metric and two host metrics. Stop a noncritical test service, verify the alert fires, restore the service and verify recovery. Then simulate the monitoring host being unreachable and confirm your external check still reports it. Keep the dashboard useful to an operator, not just visually full. Pair monitoring with the backup and restore guide so an alert can lead to a tested recovery action.
Reviewed 31 October 2026. No uptime or resource benchmark is implied by this planning guide.