Why is my VPS slow? Find the bottleneck before upgrading
A practical Linux checklist for separating CPU, memory, storage, application and network problems before changing your VPS plan.
Updated

A slow VPS does not automatically need a bigger plan. The bottleneck might be CPU contention, memory pressure, disk I/O, a full filesystem, the application itself, or the route between the user and the server. This checklist helps you collect evidence before spending money or changing a live service. It is written for a Linux VPS; commands should be run with a user allowed to inspect the system.
1. Reproduce one specific slow action
Write down the affected URL or task, the time and timezone, the client location, and whether the problem happens to everyone or one person. Test the same action twice. If a page is slow while SSH remains fast, inspect the web application and database. If both are slow, look at host resources. If only distant users are affected, compare network routes and the available locations before changing server size.
2. Take a safe, read-only snapshot while it is slow
uptime
free -h
df -h /
cat /proc/pressure/{cpu,memory,io}
uptime shows recent load averages, but load alone is not a CPU percentage. free -h shows available memory; a small “free” number can be normal when Linux uses memory for cache. df -h checks filesystem capacity. Linux pressure files show whether tasks have recently waited for CPU, memory, or I/O; compare the 10, 60 and 300 second averages during the incident instead of treating one number as a diagnosis. The Linux kernel PSI documentation explains these fields.
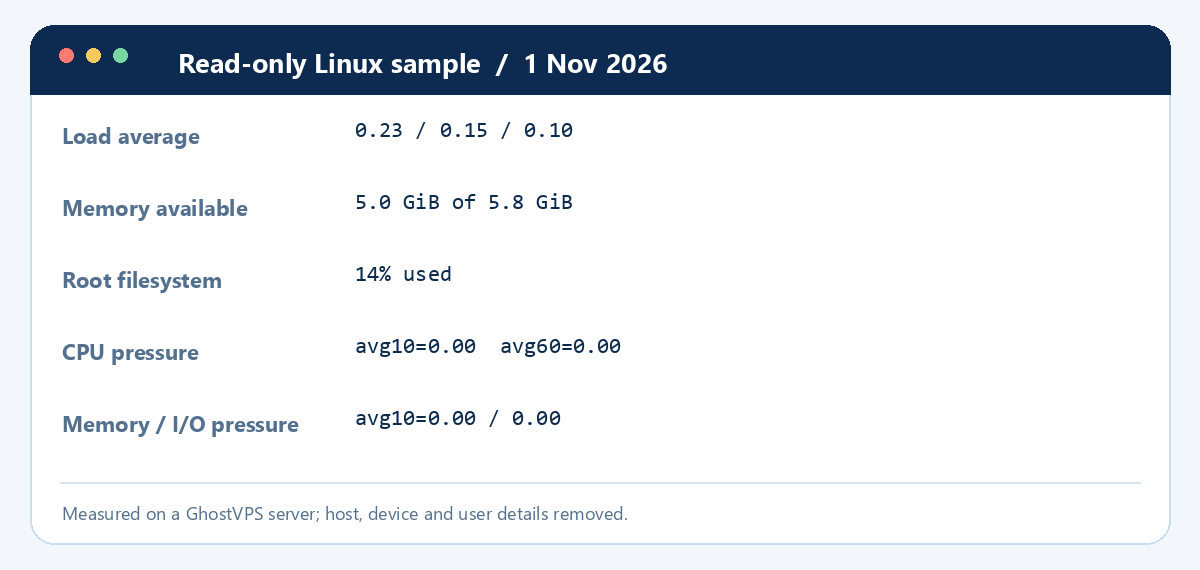
3. Follow the signal, not the plan size
| Observation | Check next | Likely action |
|---|---|---|
| CPU pressure persists during the slow action | Which process is busy? Does the application have a queue or slow queries? | Fix expensive work or assess more CPU |
| Available memory falls and memory pressure rises | Check application memory, restarts and OOM messages | Reduce memory use or assess more RAM |
| I/O pressure rises or the filesystem is nearly full | Check database writes, backups, logs and disk growth | Fix write load or storage capacity |
| Host looks healthy but one page is slow | Review application logs and database timing | Fix the application before upgrading |
| Only one network path is slow | Compare another client network and server location | Investigate route and location |
These signals are clues, not universal thresholds. Repeat a measurement during a normal period and during the incident. A dashboard from the monitoring guide helps preserve history, but a single screenshot cannot prove the root cause.
4. Check the application before buying resources
Inspect the busiest processes with top or ps, then read the relevant service log. Correlate timestamps with deployments, scheduled backups, crawlers, imports, and database jobs. If memory is exhausted, check for OOM events with journalctl -k --since "1 hour ago". Do not restart a database or delete logs merely to make the symptom disappear; record the evidence first. If you lack shell access, ask support to check the same period and send the time, affected service, and steps to reproduce.
5. Decide whether to tune, relocate, or upgrade
Upgrade only when a resource limit is persistent under a representative workload and the software is reasonably configured. If demand changes throughout the day, compare suitable Cloud VPS plans; if CPU isolation or hardware requirements drive the problem, compare dedicated servers. Verify the selected plan’s resources, location, setup fee and options in Console before ordering. Use the server selection guide for the purchasing decision.
Practical takeaway: save one baseline, reproduce the problem, identify the waiting resource, and then change one thing at a time. That gives you a way to tell whether a change actually helped.
Reviewed 1 November 2026. Commands are read-only; output varies by operating system and workload.